Evaluating 2D Drawings
Evaluating 2D Drawings
May 2019
Task
- Design an experiment to evaluate digital 2D drawings
- Comparative Analysis
- Interview professional artists for their thoughts on hand drawings and our experiment
- Implement the technologies for the experiment
- Conduct the experiment
- Present to our class and write a report to it
What I did
- Led the group discussion
- Implemented the technologies using HTML canvas
- Designed and presented the slides
- Wrote the final report
- Praised by the professor "can definitely be turned into a publishable paper"
Challenges
- Cannot find enough participants
- No other literatures looked into a comparison between artists and non-artists, or attacking the problem from an artist's perspective
What I learned
The followings are some insights we gained from the experiment:
- For artists, “area under curve” impacts their judgment on accuracy the most
- Some directions are harder to draw
- People are pushed into speed-precision tradeoff when facing different tasks
- The pressure is consistent within an individual no matter what the task is
Abstract
Starting from the SketchPad in 1963, many tools have been invented to help 2D artists create their graphics. Our experiment aims to perform a case study, comparing the performance of artists and non-artists using different tasks (trace-rating, line-tracing, dot-connecting). We conducted the experiment on 5 different participants, and learned (1) for artists, “area under curve” impacts their judgment on accuracy the most; (2) some directions are harder to draw (3) people are pushed into speed-precision tradeoff when facing different tasks; (4) the pressure is consistent within an individual no matter what the task is.
Procedure
- Design an experiment to evaluate digital 2D drawings with styluses
- Comparative analysis / market research on current styluses available on the market
- Interview professional artists for their thoughts on hand drawings and our experiment
- Implement the technologies for the experiment
- Conduct the experiment
- Present to our class and write a report to it
Interview
We interviewed professors and students in creative disciplines. There were three categories of questions: demographic, technology, and interaction technique, to get a well-rounded view of the person and their digital drawings methods.
We learned from all three interviewees that the lightweight caused by a pressure sensitive tip is incredibly important. This is an important factor in creating a more realistic digital drawing experience. Similarly, the less lag there is between where the user’s pen is and where the line is being drawn on the digital interface is creates a more realistic feel; this appeared to be slightly more important for direct drawing methods rather than indirect.
One professor, Doug Cooper, in particular, thought that computers can be “too good at being too precise”. By this, he was referencing to the “auto-neatening” of wiggly lines to straight lines or uniforming subtly varying pressure in line weight to a constant line weight, though he noted this is typically the result of the graphics software or operating system a user is using rather than directly the stylus. He thinks that it is important for lines to have character and vagueness, especially in early stages of sketches and projects, and through digitization, you often lose this and the dimensionality can become flattened. Another professor, Eddy Man Kim, noted that though digital drawings are immensely important in this new media age, students should learn analog drawing skills first to have a deft hand and then translate to digital, rather than start with digital. We think this will show in the tests in the comparison of artists drawings who were trained to hand draw to people who were not trained to hand draw.
We took some of these insights, especially the importance of pressure sensitivity, in consideration of the design of the experiment.
Experiment Design
Set Up
Initially, we planned to test three different input methods: the Wacom tablet, Apple Pencil, and mouse. However, due to the availability of technologies, as well as the scope of this assignment, we narrowed down to use only Wacom tablet on a chrome browser. The participant is instructed to sit on a chair, with the laptop on the table facing them. They will be instructed to use their dominant hand in their favored hand position.
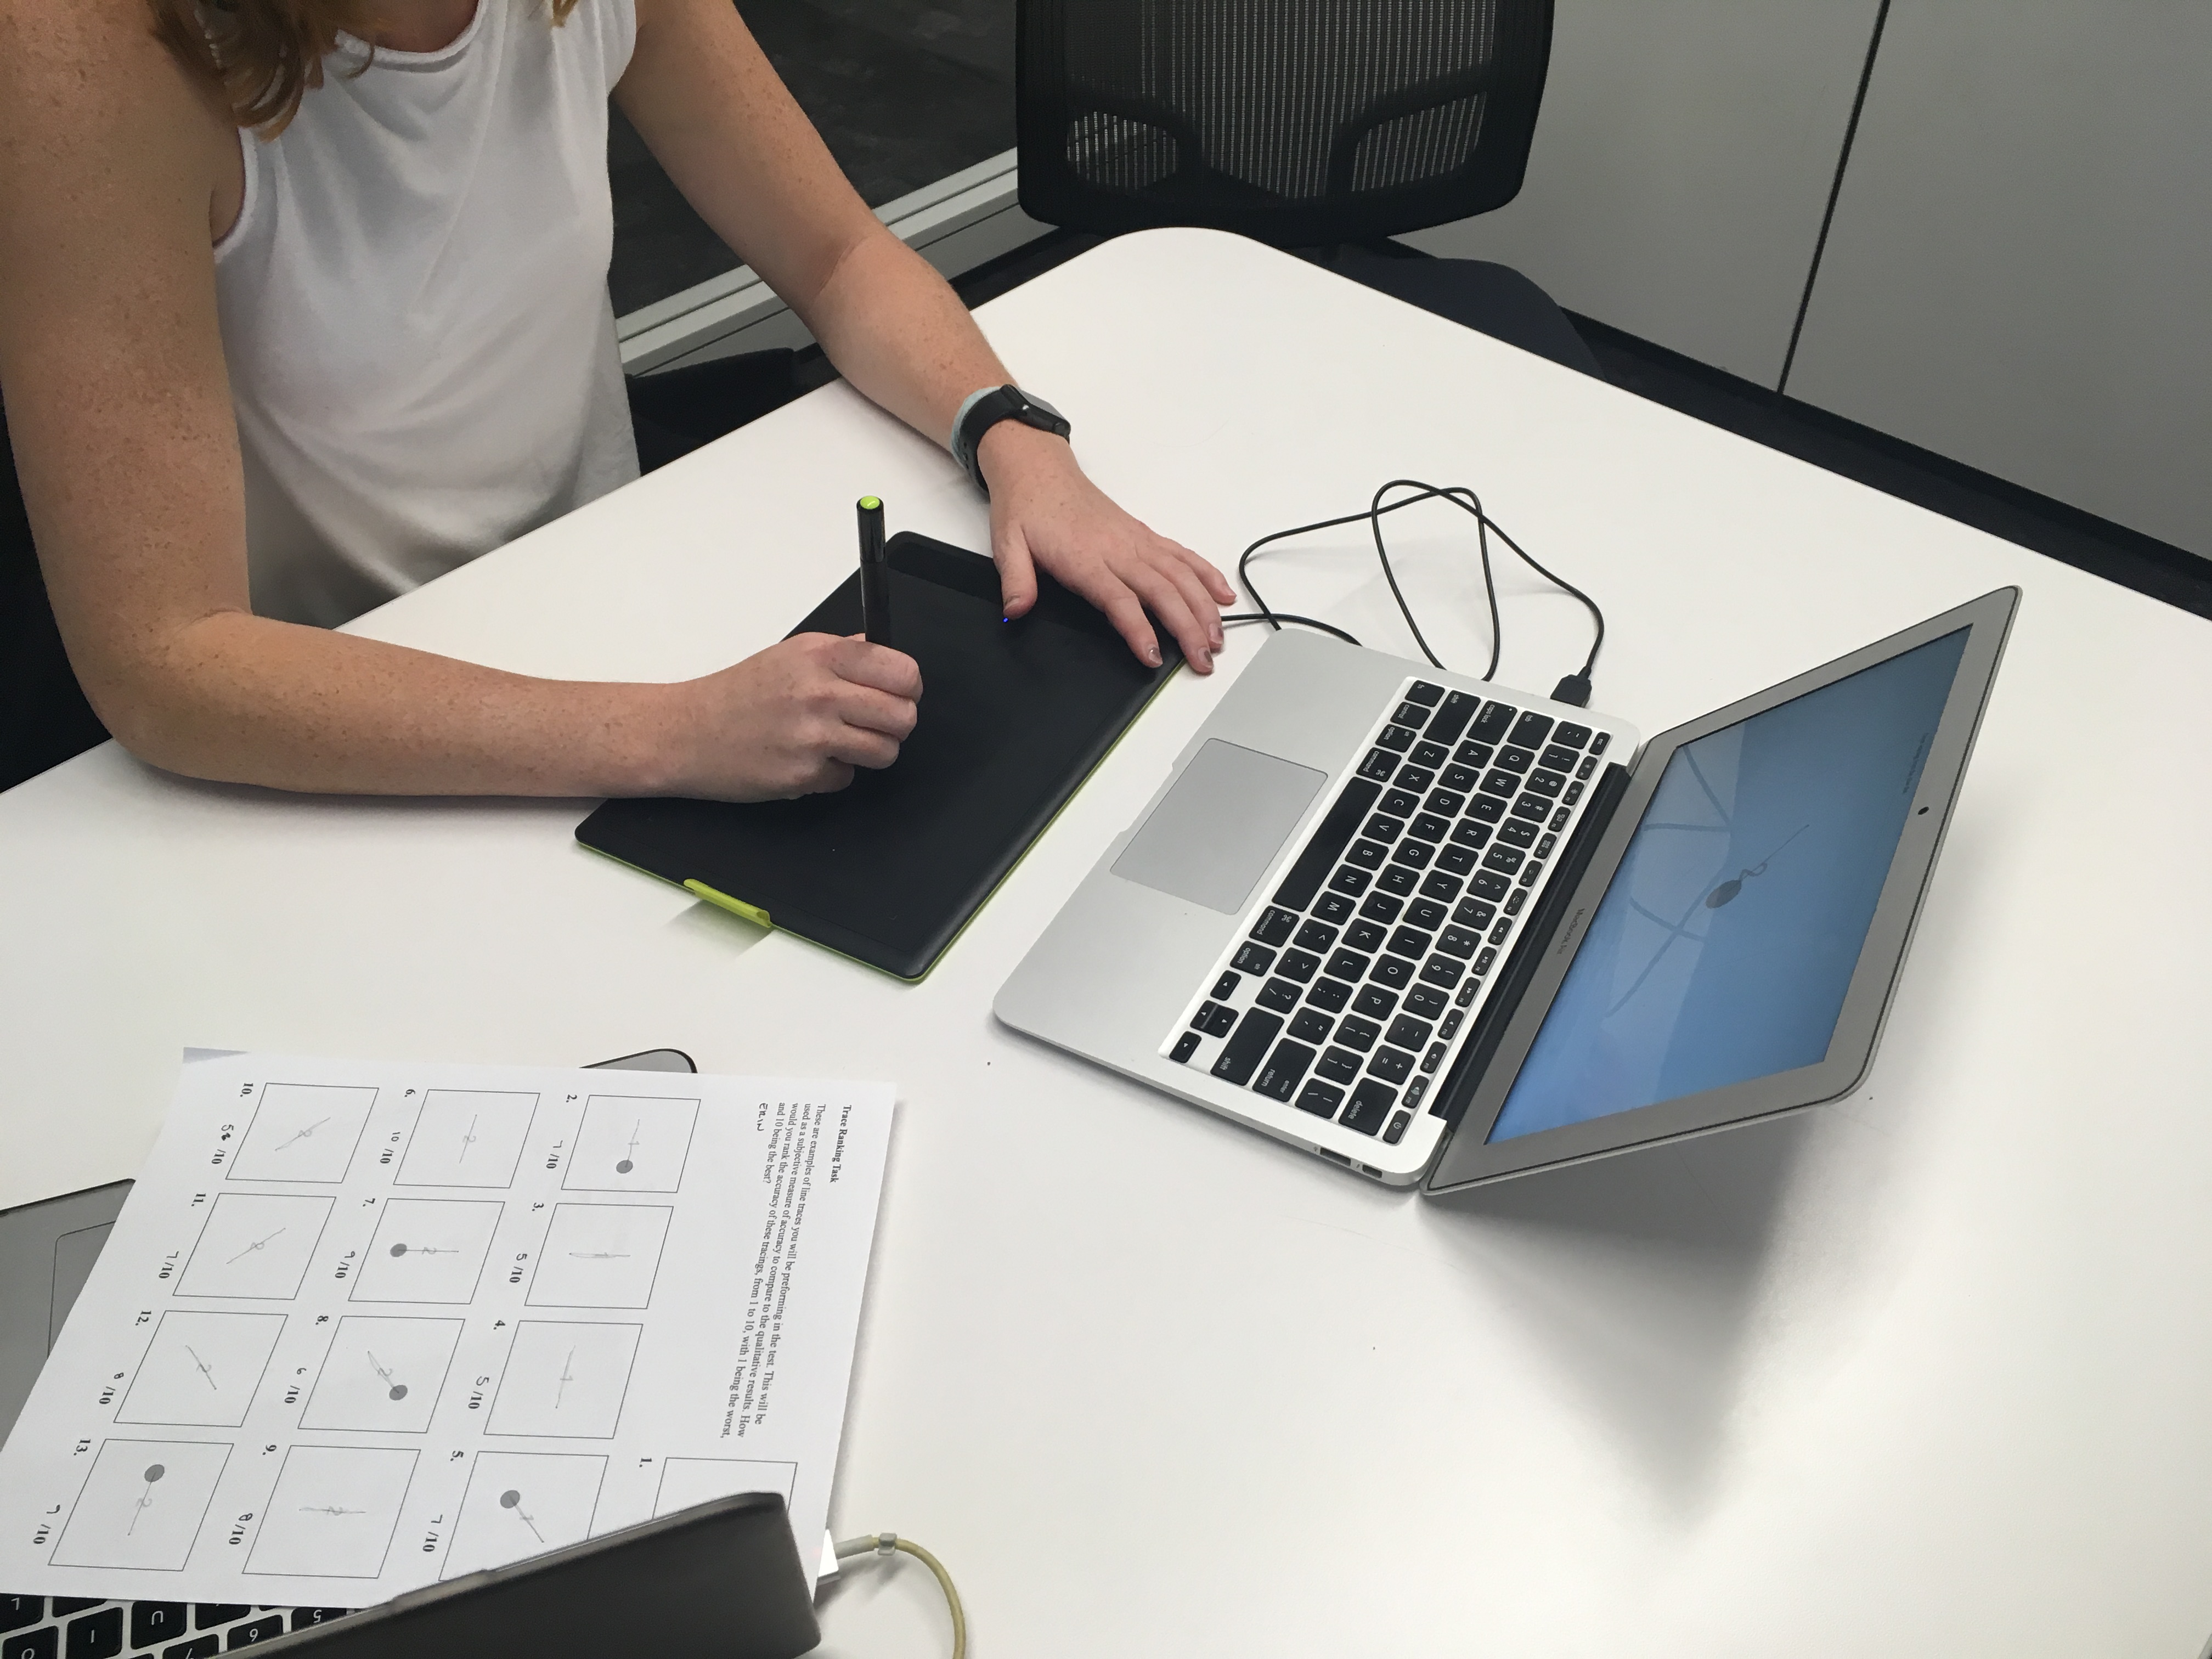
A participant is drawing with the Wacom Stylus
Participants
We plan on testing our software with people who consider themselves artists and are familiar with drawing, both analog and digital. This includes both students and professors. We also plan on testing on people who are not artists as a way of comparison. We tested our software with 3 artists (2 art students, 1 art professor) and 2 non-artists (1 computer scientist, 1 professional writer), all recruited by personal networks. Although we only tested on five participants, we planned for a participants pool with a wide diversity to compare the results between artists and non-artists.
Tasks and metrics
Task 1: Trace Rating
We showed our artists some tracing examples, and ask "How well do you think this tracing is drawn?" We made them to give it rating from 1 to 10.
"How well do you think this tracing is drawn?"
The samples will differ in qualities such as their smoothness, maximum distance off the given trace line, etc. The participants will then be asked to rate each sample tracings based on their tracing accuracies and explain their rationales. We recorded their ratings and generalized how artists perceive a line as being accurate.
Task 2: Line Tracing

Software interface during Task 2: Line Tracing. Top left: Before the participant starts to stroke. Bottom left: while the participant is stroking. Right:while the participant is stroking, annotated.
The trace line varies in length, slope, and direction. Each participant will complete the line tracing task in 10 runs of the eight directions of lines, totaling to 80 lines drawn. A test run will be conducted at the beginning of each session to familiarize the participant with the interaction technique. The participants are instructed to draw the lines as quickly and accurately as possible while staying within the proper pressure.
Task 3: Dot Connecting

Software interface during Task 3: Dot Connecting. Top left: Before the participant starts to stroke. Bottom left: while the participant is stroking. Right:while the participant is stroking, annotated.
The trace line varies in length, slope, and direction. Each participant will complete the line tracing task in 10 runs of the eight directions of lines, totaling to 80 lines drawn. A test run will be conducted at the beginning of each session to familiarize the participant with the interaction technique. The participants are instructed to draw the lines as quickly and accurately as possible while staying within the proper pressure.
Results & Discussions
Using Numbers, Apple’s equivalent of Microsoft Excel, we performed several data visualizations on the data we gathered, which resulted in some interesting findings:
- “Area under curve” impacts an artist’s judgment on accuracy the most.
- Some directions are harder to draw
- For some people, the pressure is consistent within an individual no matter what the task is
- Speed-precision tradeoff
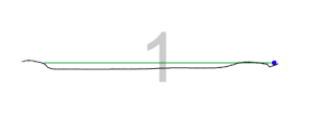
Insight 1: “Area under curve” impacts an artist’s judgment on accuracy the most.

The dark line denotes the user line, the green line denotes the trace line. The grey area in between them is the “area-under curve”.
During task 1: Trace Rating, artists tend to rate those with a higher “area under curve” with a lower score. That is, the further the user line deviates from the trace line, the worse the artists think the line is traced. However, artists disagree with each other when it comes to the smoothness of the curve. Some artists factor smoothness a lot into their ratings, while other artists appear to be not heavily influenced by it.
Insight 2: Some directions are harder to draw

Eight directions the participants drew during the experiment.
During the data analysis phase, we found that some certain directions are harder to draw. Participants drawing in direction #4, #5, and #7 either took longer time to finish their stroke, deviate a lot from the given trace line, or both.
How do we measure their performance in each direction? For a given participant and a given direction, we calculate the average time it takes to finish a line stroke and the average distance between the user line and the trace line. Multiplying the time and distance together, we were able to obtain a rough estimate of their performance score. The higher the performance score is, longer and more inaccurate participants stroked in the experiment, and the worse they draw.
The direction in which the participant has the highest performance score. Note that participant 4 performed equally bad on direction #4, #5, #7, with only a 1% difference between their performance scores. (Other directions listed in this table differ from their second-to-worst by 6% ~ 23% in their performance score)
| - | Participant 1 | Participant 2 | Participant 3 | Participant 4 | Participant 5 |
|---|---|---|---|---|---|
| Task 2: Line-tracing | 4 | 5 | 4 | 4, 5, 7 | 8 |
| Task 3: Dot-connecting | 7 | 8 | 5 | 7 | 3 |
As we can see in the table above, direction #4, #5 and #7 occur more frequently. This is suggesting that #4, #5, #7 have a higher performance score, and thus are harder to draw.
Insight 3: The pressure is consistent within a individual no matter what the task is
Due to some technical problems with JavaScript, we were only able to collect the pressure tracing data from participant #3, #4 and #5. Among all of them, we found that they tend to apply the same amount of pressure in a given direction.
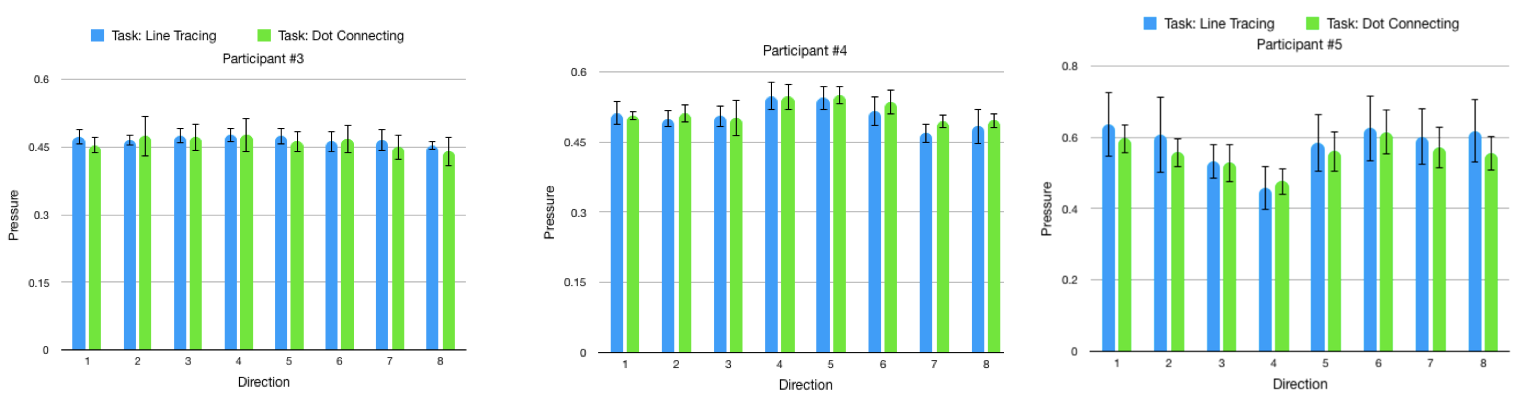
Average pressure applied in each direction by Participant #3, #4 and #5
This is similar to what we had in Insight 2: people apply different strategies while drawing, and the amount of art training they received, as well as their natural hand structures, can affect the pressure they applied to their pen tip. However, this “pressure trait” is not as obvious when it comes to speed and accuracy metrics.
Insight 4: Speed-precision tradeoff
The two drawing tasks, Line-Tracing and Dot-Connecting, differ from each other in that people attack the two drawing tasks differently.
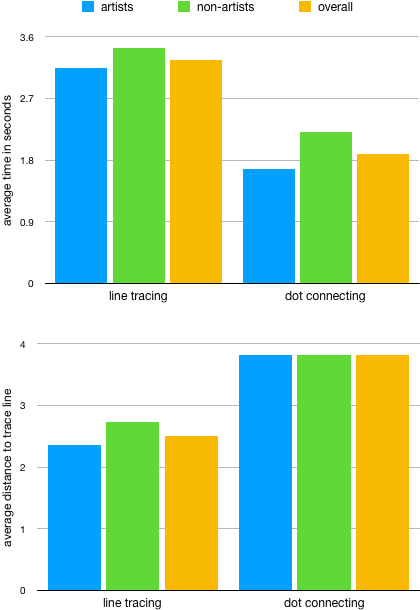
Bar chart of the average time per stroke and distance to trace line of each participant.
In general, artists draw both faster and more accurate than non-artists. However, when they are doing the line-tracing task, both artists and non-artists tend to focus on their accuracy; when they are doing the dot-connecting task, both tend to focus on the speed.
This results in the well-known speed-accuracy tradeoff, which has been found in other literature too: in Gowen and Miall’s 2006 study, it was found that people have small saccades in front of the moving pen during tracing tasks; when it came to drawing, however, the gap between saccades grew larger. It is thus suggested that tracing “demands continual comparison between the line to be traced and pen tip, which in turn requires the continual transfer of this visual information to the hand movement system.” Drawing, on the other hand, has less emphasis on visual feedbacks and memory-guidance would play a more critical role.
Presentation Slide
Check out more
Personal Website Remastered
Redesigned my personal website for future potential employers.